Weekly Austin Real Estate Market Update

Austin Real Estate Weekly Market Update – August 14, 2025

by: Dan Price, Broker at Team Price Real Estate
Austin's leading data analysis brokerage, where data drives exceptional service
Published on: Thursday, August 14, 2025 at 09:38 am

The August 14, 2025 Austin real estate market update reveals a housing landscape that is steadily shifting toward balance, with growing inventory, mixed pricing trends, and increasing negotiation power for buyers. Across the Austin-Area MLS, active listings have risen 7.9% year over year, giving house hunters more options than in recent memory. The City of Austin continues to stand out with stronger price growth than the region as a whole, but even with these gains, both city and regional markets remain well below their 2022 and early 2025 price peaks. This analysis covers the latest Austin housing market trends, including inventory changes, pricing patterns, and what these shifts mean for buyers, sellers, investors, and real estate agents navigating the current market. 

Image

Inventory Expands Across the Austin Housing Market

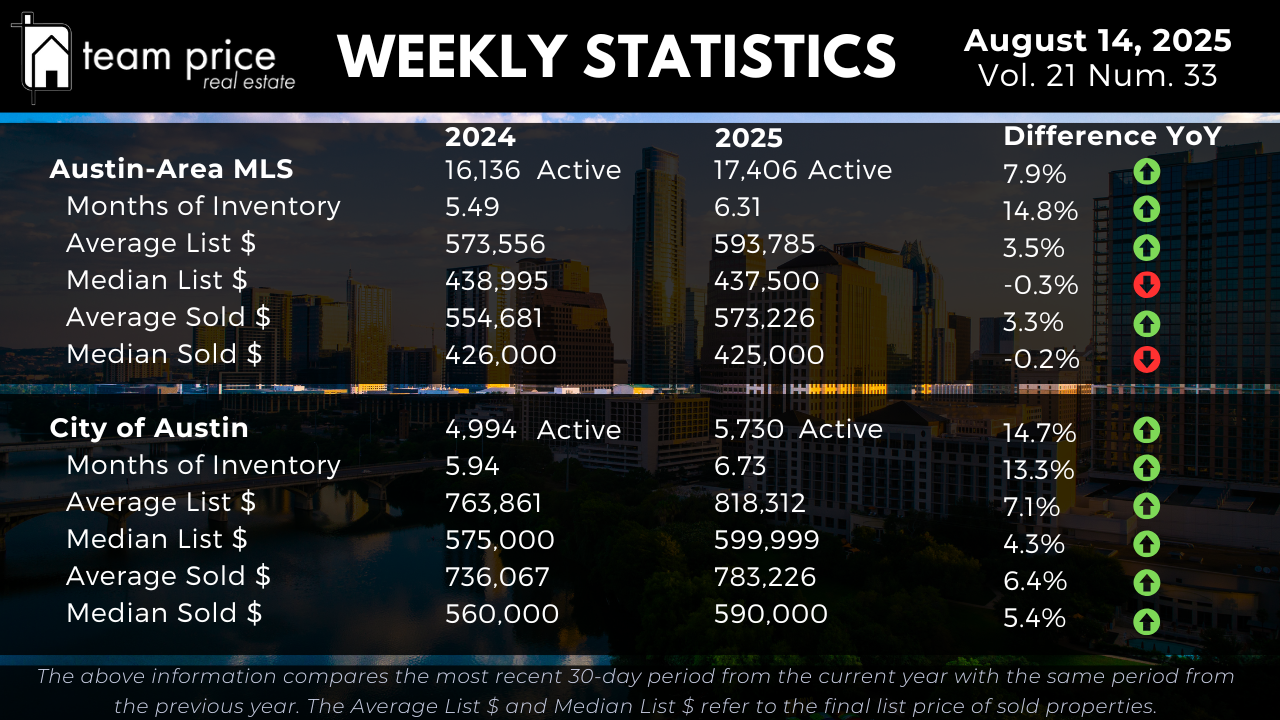
The Austin real estate market continues to shift toward a more balanced environment. Across the Austin-Area MLS, active residential listings have climbed to 17,406, up 7.9% from 16,136 at the same time last year. Months of Inventory now stands at 6.31, compared to 5.49 a year ago — a 14.8% increase that reflects a 1.1× expansion in supply relative to the current pace of sales. Within the City of Austin, the supply increase has been even more significant. Active listings rose from 4,994 to 5,730, a 14.7% gain, while Months of Inventory increased from 5.94 to 6.73, up 13.3% year over year. This steady growth in available homes gives buyers more options and eases some of the urgency that characterized the market in recent years.

Austin Housing Prices Show Diverging Trends

Price trends across the Austin-Area MLS highlight a split between average and median values. The average list price rose 3.5% to $593,785, and the average sold price increased 3.3% to $573,226. In contrast, the median list price fell 0.3% to $437,500, and the median sold price dipped 0.2% to $425,000. This pattern suggests that higher-priced sales are helping lift averages, while mid-tier home values remain flat. In the City of Austin, pricing strength is more consistent. The average list price is up 7.1% year over year to $818,312, and the median list price has climbed 4.3% to $599,999. On the sales side, the average sold price rose 6.4% to $783,226, while the median sold price increased 5.4% to $590,000. These gains point to greater resilience inside city limits compared to the broader region.

Regional and ZIP Code-Level Market Performance

Market conditions vary widely across Central Texas. Among the 30 tracked cities, 40% saw month-over-month median price gains in August, while 57% recorded declines. On a year-over-year basis, only 33% of cities posted price increases, with 67% reporting decreases. None have surpassed their 12-month price peak. At the ZIP code level, the distribution is similar. Of the 75 areas analyzed, 45% reported month-over-month gains, 51% declined, and 4% held steady. Year over year, 48% are up and 52% are down. Only one ZIP code has exceeded its 12-month high, underscoring how widespread the price normalization has been since earlier market peaks.

Negotiation and Seller Concessions Becoming Standard

Most homes are now selling below their original asking price. In August, 69.43% of closed sales were below list price, compared to 65.95% last month. The share of homes selling at list price dropped from 21.86% to 18.21%, while 12.36% sold above list — a figure that has held steady month to month but is down from July 2024’s 13.21%. The average sold-to-list price ratio sits at 97.05%, reflecting a market where negotiation is common and seller flexibility is often required to secure a sale.

Prices Remain Below Peak Levels

Despite some recent gains, prices remain well below their highs from 2022 and early 2025. In the Austin-Area MLS, the average list price is down 11.5% from its April 2025 peak, and the median list price is 16.7% below its May 2022 high. The average sold price is 9.6% lower than its peak, while the median sold price is down 19.2%. Price-per-square-foot metrics have dropped 21.9% (average) and 23.2% (median) from their 2022 highs.

In the City of Austin, the average list price is 17.2% below its April 2024 peak, and the median list price is 17.2% under its May 2022 high. The average sold price is only 2.3% below its May 2022 peak, but the median sold price is still down 14.1%. Price per square foot has fallen by more than 22% compared to its previous high.

What This Means for Buyers, Sellers, Investors, and Agents

For buyers, the increase in inventory and longer market times translate to more choices, better negotiation opportunities, and less pressure to make quick decisions. Median prices in many areas are flat or slightly down, which could open doors to better value, especially outside the city core.

For sellers, competition has increased, and pricing strategy matters more than ever. Homes priced appropriately for the market are still selling, but the high percentage of below-list-price transactions shows that many sellers need to adjust expectations.

For investors, the current market offers the chance to acquire properties at prices still well below recent peaks. While rent growth has cooled, the combination of lower purchase prices and steady demand in key neighborhoods may present attractive long-term opportunities.

For real estate agents, understanding hyperlocal trends is critical. With conditions varying widely between ZIP codes and even within neighborhoods, guiding clients with precise, data-backed advice will be the key to success in the months ahead.​

Austin Area Residential Sales Insights

FAQ Section

1. How has Austin housing inventory changed in the past year?

Over the past 12 months, the Austin-Area MLS has seen a meaningful increase in available homes, rising from 16,136 to 17,406 active residential listings — a 7.9% gain. This growth has also pushed Months of Inventory from 5.49 to 6.31, meaning that at the current pace of sales, it would take more than six months to sell all existing listings without new properties coming on the market. In the City of Austin, the change is even more pronounced. Active listings jumped 14.7%, from 4,994 to 5,730, and Months of Inventory rose from 5.94 to 6.73. This expansion in supply is giving buyers more selection, reducing the time pressure that was common in previous years, and helping to ease upward pressure on prices in some segments.

2. Are home prices going up or down in Austin?

The answer depends on where you’re looking. Across the broader Austin-Area MLS, average prices have inched higher — the average list price is up 3.5% to $593,785 and the average sold price is up 3.3% to $573,226. However, median prices, which better reflect the middle of the market, are slightly down year over year, with the median list price slipping 0.3% to $437,500 and the median sold price dipping 0.2% to $425,000. Inside the City of Austin, prices are showing more consistent strength. The average sold price has increased 6.4% to $783,226, and the median sold price has climbed 5.4% to $590,000, suggesting that demand for homes in the city remains stronger than in the outer parts of the metro area.

3. What percentage of homes are selling below list price?

In August 2025, nearly seven out of ten homes in the Austin-Area MLS — 69.43% — sold for less than their original asking price. This is up from 65.95% the previous month and marks a clear trend toward greater buyer leverage. The share of homes selling at list price has fallen from 21.86% to 18.21%, while 12.36% of sales have closed above list price, a level that has remained steady month-to-month but is below last year’s 13.21%. The average sold-to-list price ratio now sits at 97.05%, meaning sellers are accepting offers at roughly 3% below their asking price on average. This is a sign of a more balanced market where buyers and sellers negotiate terms more often.

4. How does the current market compare to past peaks?

Even with recent gains in some categories, prices remain below their highs from 2022 and early 2025. In the Austin-Area MLS, the average list price is 11.5% lower than the April 2025 peak, while the median list price is down 16.7% from May 2022. The average sold price is 9.6% below its peak, and the median sold price is down 19.2%. Price-per-square-foot figures are down 21.9% (average) and 23.2% (median) from their highest points. In the City of Austin, the average list price is 17.2% lower than its April 2024 peak, while the median list price is 17.2% under the May 2022 peak. The average sold price is only 2.3% off its May 2022 high, but the median sold price is still down 14.1%. These figures show that while the market has regained some strength in select areas, it has not fully recovered to its most competitive periods.

5. What does this mean for buyers, sellers, and investors?

For buyers, the market is offering more choices, less competition, and more negotiating room. This is especially true outside of Austin’s core, where median prices have flattened. Sellers, on the other hand, face a more competitive landscape and should be prepared to price strategically and remain flexible during negotiations. Investors have a unique opportunity to acquire properties at prices still well below peak values, potentially benefiting from long-term appreciation as the market stabilizes. For real estate agents, the shifting conditions highlight the need for hyperlocal market knowledge — understanding ZIP code-level trends and advising clients accordingly is critical in navigating this stage of the market cycle.​

Latest Articles


No articles found.